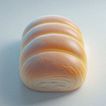
Export and import prices of Finger bun
Historical export and import price trends
The global export and import prices of Finger bun have been on the rise over the past two years, driven by shifts in market supply and demand. In 2023, export and import prices ranged from $2.18 to $8.85 USD per kg. By 2024, these prices increased to a new range of $2.37 to $10.69 USD per kg, highlighting the continued growth in the international price of Finger bun.
Recent transaction records
On 2025-01-17, Finger bun reported as "[빵류] 수도__PEACH SHAPE BUN" was exported by a company in China to a company in South Korea.
See the table below for more recent transactions.
To access detailed information, including unit prices and company names, get full access to our Transaction Data.
Get latest market insights & trade transaction data
Transaction Data | In-depth analysis
Access detailed transaction records and company analysis for Finger bun, sourced from B/L and customs data. Monitor competitor activities, identify new trade partners, and analyze export/import prices. Use transaction data for deeper insights and more informed business decisions.
FAQ for global Finger bun price
Where does Tridge source its price data?
Tridge gathers price data from over 400 trusted global sources, including government public sources, producers, traders, and local industry experts. We ensure data accuracy through both human oversight and cutting-edge AI technology, which helps manage missing values, detect outliers, and standardize currency and units.
How are the low and high prices for Finger bun calculated?
The low and high prices are based on global data for Finger bun during the selected period, showing the typical price range across countries after removing outliers. Please note that price trends may vary when analyzed in more detail, such as by specific countries, product varieties, or different timeframes.
How much transaction data is available for Finger bun on Tridge?
We have 2028 transaction records for Finger bun across 82 import countries and 54 export countries. Visit our About Transaction Data page to explore its features.
Related products of Finger bun
Check the prices of other products related to Finger bun
Products used to produce or made with Finger bun
Finger bun prices by country
Explore the prices of Finger bun across different countries
· · · · · · · · · · · · · · · · · · · · · · · · · · · · · · · · · · ·


By clicking “Accept Cookies,” I agree to provide cookies for statistical and personalized preference purposes.
To learn more about our cookies, please read our Privacy Policy.